
What is Technical Analysis & Why and How to Learn it?
In the world of stock market, people are often in search of such tools and strategies which can help them in making quick money from the market. One such tool or method which has been very popular almost since the beginning of trading is technical analysis. Technical analysis is a method that investors and traders use to predict price movements in stock, currency, commodity and derivative markets. Many of you might have heard about it but very few people would be aware of it. In today’s article, we will learn in detail about technical analysis, its concept and method of learning. After reading this article, you will completely understand about technical analysis and know why traders and investors give it so much importance.
What is Technical Analysis?
Technical analysis is a method of analyzing an asset or stock in which its future price is predicted by looking at the historical movement of the price chart of that asset. Technical analysis helps you to know at what price any share should be bought, how long it can be held and at what price it should be sold.
It is often said in the stock market that all the information about the increase and decrease in the price of a stock is hidden in its price chart and if one learns to analyze and understand it well, then anyone can become a great player in the stock market. Could. Technical analysis is also based on this, where an attempt is made to predict the further movement of the stock with the help of only the price movement of the chart and many other tools called indicators.
Unlike fundamental analysis where stocks are selected for long term investing by studying only the balance sheet, financial ratios and market trends, technical analysis mainly focuses on price action and price volume to draw conclusions and is mostly short term. Used for term trading.
How does technical analysis work?
There is a saying that we hear many times, “History repeats itself” and the same holds true for technical analysis. What do we analyze in technical analysis? Historic market data. That is, data on how the price of a stock, commodity, currency has performed in the past and the possibility that the stock can repeat its past price action.
The second thing that plays an important role in technical analysis is the market trend. Everything in the stock market moves in trend and this trend can be of three types. Uptrend, downtrend and sideways. The price of any stock moves on one of these three trends at a time. In an uptrend, the price of the stock continuously moves upwards in the formation of higher high and higher low, whereas in a downtrend, the price of the stock continuously decreases in the formation of lower high and lower low. In sideways market, the price does not move in any one direction but keeps moving through a channel or price range.
Due to the trend of price, many types of patterns are formed in the stock chart, on the basis of which we can predict the future price movement of the stock. For example, the chart pattern given below is called double top pattern.
According to this pattern, when the stock price tries to go up by breaking its middle neckline or the middle price of the pattern, then it is considered as a buy signal and the trader can take this trade with the per-determined target and stop loss price level. Is. There are many similar chart patterns in technical analysis like falling wedge, cup and handle, bullish/bearish flag, ascending triangle etc. which work very well in favorable market conditions. Apart from these patterns, there are many tools and indicators which help us in taking any trade decision in technical analysis.
Tools of technical analysis
Price Chart: Price chart can be called the basis of technical analysis. It shows the price movement of any financial instrument over a specific time frame by plotting it in a chart. Candlestick charts, bar charts and line charts are most commonly used in technical analysis.
Indicators: Indicators are tools used in technical analysis which are made on the basis of some mathematical calculations. They drive their data from price action and give buy and sell signals based on that. Some commonly used indicators are moving average, bollinger bands, RSI etc.
Chart Patterns: Patterns are a type of chart formation that are formed due to the price movement of a stock. Based on these chart formations, the trader can decide to buy or sell a stock.
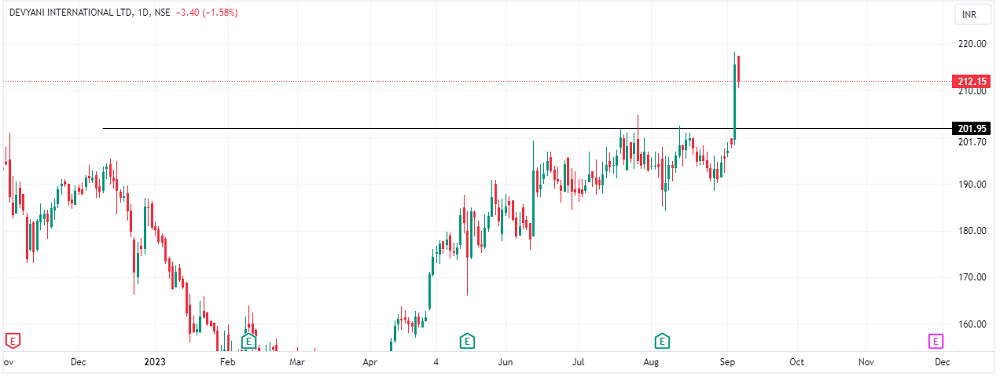
Support and Resistance: Support is the price level at which buyers become active on a stock and prevent its price from falling further. On the contrary, resistance is that price level where sellers of the stock are active and prevent the price of the stock from increasing further. These two levels play an important role in technical analysis.
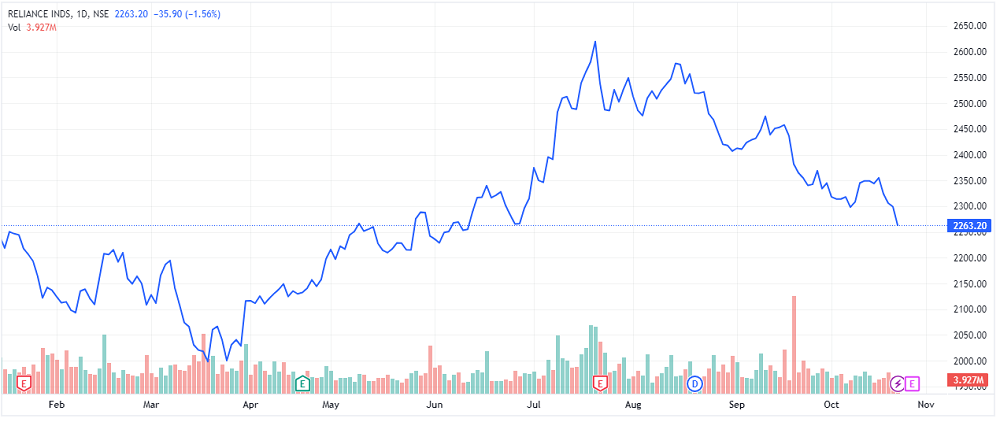
Volume: The quantity in which stock is transferred from a buyer to a seller and from a seller to a buyer is called volume. In simple language, volume means how many shares have been traded in a specific time frame. If the volume of shares is high then we can assume that many traders are interested in that share, whereas if the volume is low then we can say that the chances of the price going in the same direction in the future are less.
Types of charts
In technical analysis, mainly an attempt is made to understand charts and chart patterns. There are many types of charts and traders use them depending on their convenience and skill. Some of the most commonly used charts are:
Line Chart: This is the simplest form of chart. In this, price movement is shown only through line graph. This line graph is based on the closing price of the stock and detailed information is not available in it.
Bar Chart: This chart shows the high, low, open and close price of the stock in a certain time frame. They provide better information than line charts and are used by many traders.
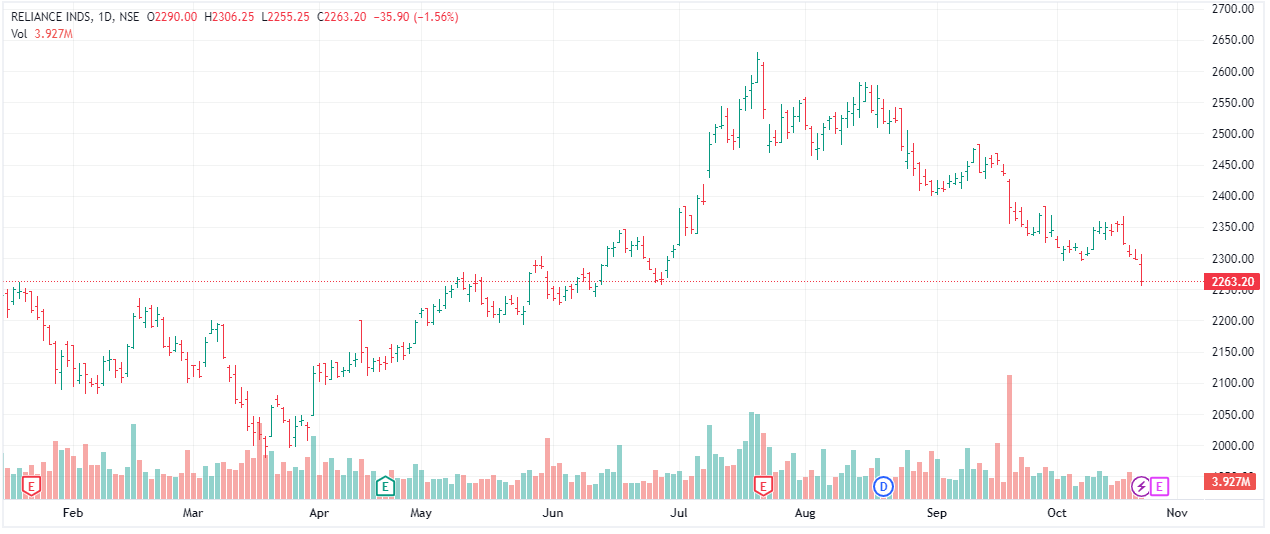
Candlestick Chart: Candlestick charts are a gift from Japan and were used by rice traders there. They present the price movement of the stock in the best way, hence using them it becomes very easy to take any kind of trading decision.
How to learn technical analysis?
Technical analysis is a skill that can help us a lot in making trading and investing decisions. To learn this, there are many free videos, blogs and courses available on the internet and social media from which you can easily get information about it. Apart from this, there are some steps given below which can be followed to learn technical analysis step wise from beginning to end.
Start from Basic: First understand the basic concepts of technical analysis on the basis of which it works like price, volume, charts, support and resistance and indicators etc. Read about it thoroughly and try to understand the price movement on the chart.
Trading Books: The best way to learn about anything is to learn it from people who are experts in that field. There have been many such traders in history who have earned crores of rupees with the help of technical analysis in the stock market. Some such traders and the books written by them are: “Technical Analysis of the Financial Markets” by John J. Murphy and “Japanese Candlestick Charting Techniques” by Steve Nison. By studying these books, you will get thorough knowledge of all the basic and advanced concepts of stock market and technical analysis.
Understand technical indicators: As already mentioned, technical indicators are some tools which give you buying and selling signals on the basis of price data. Study these indicators and try to use them in your trading strategy.
Join the trading community: Social media, Telegram and many charting platforms have communities of traders who discuss and share things related to technical analysis and charts. Join such communities and try to overcome the difficulties related to technical analysis.
Do paper trading: There are many sites and apps online which allow us to do paper trading. Paper trading does not involve any kind of real money and is done only with virtual money through the app. In this you can trade exactly like the real stock market and the practice done in this way helps you a lot in trading in the future. You can practice your technical analysis knowledge on these platforms without any loss.
Create a trading journal: A trading journal is a trading record that contains accounts of the trades you make on a daily basis. In this, keep notes of when the trade was taken, what is the reason for taking it, stop loss, target and on the basis of which chart pattern the trade was taken etc. which is a good way to improve your trading by finding your mistakes and shortcomings.
Backtesting: Backtesting means testing the trading strategy you are using on historical data before using it in the real market. By doing this you will get to know whether a chart pattern and strategy works or not in trading.
Risk Management: The most important and important thing to pay attention to in learning and trading technical analysis is risk management. Risk management means entering into any trade by managing your trading properly so that even if the trade goes in your opposite direction, you know how much loss you can incur and when to exit the trade. If we understand risk management in simple language, then keep in mind the target and stoploss of the trade taken.
Right Mindset: The mindset of the person doing it plays a big role in the success of any business or work. A positive and disciplined mindset can improve your trading manifold. Whatever be the strategy or chart pattern, if it is used as discipline by following the rules properly, then you will remain in profit even if less trades are placed correctly.
Continuous learning: Any business keeps changing according to the market, technology and people’s thinking. Similarly, in stock market and technical analysis also, new technologies and rules keep coming with the passage of time. Therefore, it is important that you keep improving your mindset and trading with time so that you will be able to survive in trading even in adverse circumstances.
Also see Top Stock Market Courses in Delhi NCR:
- Stock Market Courses in Delhi With Fees & Duration
- Stock Market Courses in Noida With Fees & Duration
- Stock Market Courses in Ghaziabad With Fees & Duration
- Stock Market Courses in Greater Noida With Fees & Duration
- Stock Market Courses in Faridabad With Fees & Duration
- Stock Market Courses in Gurgaon With Fees & Duration
Conclusion
Almost every trader uses technical analysis in short term trading. It requires less time and less skill as compared to fundamental analysis. Also keep in mind that learning and applying technical analysis is an ongoing process. It gets better with practice. You should work on any strategy in the long term instead of the short term and with the passage of time you will become an expert in it. Do not be afraid of loss because it is a part of trading and trading cannot be done without it. Yes, such a discipline can definitely be brought in that in every trade you have minimum loss and the profit is much more than that.